

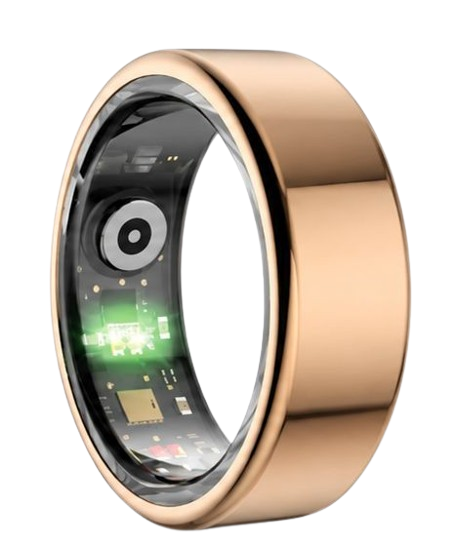
Tracking your nightly rest with a precise sleep graph is the single most effective way to identify hidden recovery deficits and optimize your physical energy. According to the National Sleep Foundation, over sixty percent of adults experience sleep disruptions that go completely unnoticed without biometric monitoring. The Herz P1 Smart Ring continuously tracks your physiological transitions, helping you decode complex biometric trends directly from your finger without any monthly subscription fees.
Built to Last. Save Up to 69% Today.
The Herz P1 Smart Ring tracks HRV, Sleep, Heart Rate & SpO2 around the clock. No subscriptions. No renewals. Ever.
In This Article
- How to Read a Sleep Graph Overnight: A complete step-by-step tutorial to analyze your personal hypnogram data.
- Decoding the Science of Sleep Architecture: Understanding normal sleep charts and deep vs. REM physiological parameters.
- Applying Biometric Sleep Trends: Practical daily habits to improve your cognitive readiness and minimize physiological stress.
- Avoiding Sizing and Usability Pitfalls: How sensor placement affects your data integrity and tracking accuracy.
- Common Tracking Questions Answered: Complete expert breakdowns of water resistance, battery health, and offline storage.
How to Read Your Sleep Graph: A Step-by-Step Tutorial

Prerequisites / What You’ll Need
To analyze your personal sleep architectural health, you need a continuous biometric tracker and a week of baseline records.
Make sure your tracking device maintains direct skin contact to prevent signal dropouts during movement.
You also need a basic understanding of your baseline sleep duration goals to contextualize the metrics.
-
Step 1: Identify Your Sleep Latency and Initial Onset
Look at the far left of your daily hypnogram to see exactly when your tracking began.
This early segment represents the transition period from active wakefulness to light sleep.
Understanding what sleep latency means helps you determine how quickly your nervous system settles down at night.
A normal latency window ranges from ten to twenty minutes.
If this phase is shorter than five minutes, you may be dealing with chronic exhaustion.
-
Step 2: Locate Your Deep Sleep Valleys
Identify the lowest troughs on your chart, which usually occur during the first half of the night.
These deep drops represent slow-wave sleep, which is the most physically restorative stage.
Your heart rate typically drops to its lowest daily point during this phase.
Healthy adults should spend fifteen to twenty-five percent of their total sleep time in this deep stage.
Ensure these valleys are sustained and not interrupted by frequent wake spikes.
-
Step 3: Analyze Your REM Sleep Peaks
Look for the high peaks clustered closely together toward the second half of your sleep chart.
These peaks indicate Rapid Eye Movement periods, when your brain processes memories and emotions.
A typical rem sleep graph shows that these cycles get longer as morning approaches.
Your breathing and heart rate often fluctuate rapidly during this stage.
Aim for REM sleep to make up roughly twenty to twenty-five percent of your night.
-
Step 4: Check for Sleep Fragmentation and Awake Spikes
Examine the thin, sharp vertical lines that rise all the way to the top of your visual graph.
These spikes show moments when you briefly woke up, even if you do not remember them.
A normal sleeping graph usually has a few brief micro-arousals each night.
However, excessive awake spikes point to a fragmented sleep structure, which can drain your energy.
Look for environmental causes, like noise or temperature shifts, that might be disrupting your rest.
-
Step 5: Review Your Total Restorative Sleep Balance
Step back and look at how your light, deep, and REM cycles are balanced across the night.
Compare your overall patterns to a standard normal sleep cycle graph to see if your sleep is structured well.
Your total sleep time should consist of a repeating, smooth wave pattern with four to six complete cycles.
If your sleep waves look jagged or incomplete, you may need to adjust your evening routine.
Keep tracking these patterns over several weeks to spot meaningful trends.
Enhancing Your Journey with Team Herz P1
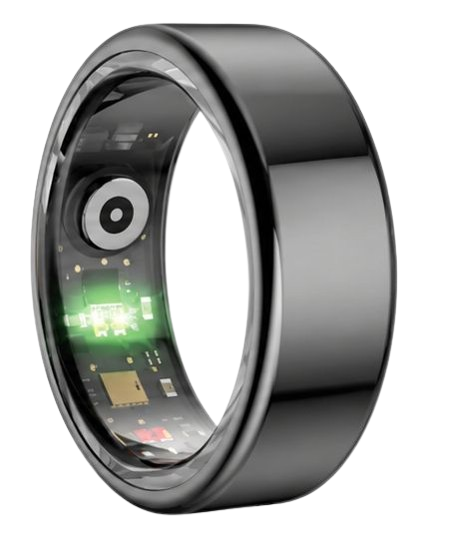
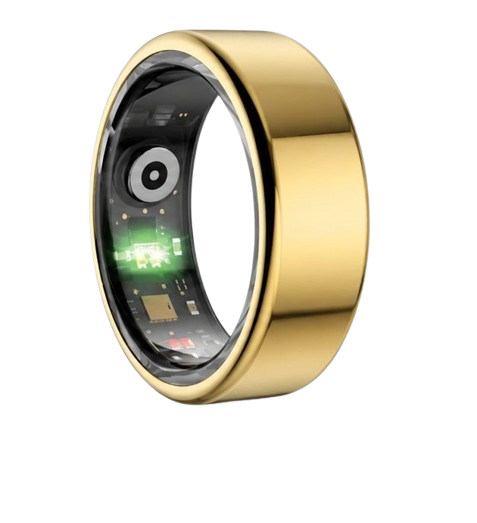
The Herz P1 Smart Ring makes tracking these sleep stages simple by providing clinical-grade monitoring in a lightweight, comfortable finger-worn design.
It works continuously in the background, sending highly accurate data directly to your phone without any annoying monthly subscription fees.
By wearing the Herz P1 every night, you can build a reliable biometric history to optimize your sleep and boost your daily energy.
Explore the full capabilities of the Herz P1 Smart Ring to take charge of your nightly recovery.
Decoding the Science of a Normal Sleep Cycle Graph

A healthy night of rest is built on a series of predictable, structured sleep cycles.
Each cycle lasts between ninety and one hundred and twenty minutes, repeating throughout the night.
A standard normal sleep cycle chart shows four to six of these cycles over an eight-hour period.
The progression moves from light sleep into deep sleep, then rises back up to end in REM sleep.
Understanding these transitions helps you see how your body recovers and processes the day.
Your autonomic nervous system changes dramatically during these different sleep stages.
In deep sleep, your parasympathetic nervous system takes over to lower your heart rate and blood pressure.
This drop allows your tissues to heal, muscles to rebuild, and growth hormones to release.
During REM sleep, sympathetic activity increases, causing heart rate and brain activity to fluctuate.
These shifts are essential for consolidating memories and keeping your mind emotionally resilient.
Continuous heart rate variability (HRV) tracking provides key insights into how deep your sleep cycles are.
A high nightly HRV indicates that your body is recovering well and adapting easily to stress.
Conversely, a low HRV score during sleep suggests your body is still dealing with physiological fatigue.
Tracking these trends over time helps you understand how daytime activity affects your nightly rest.
With this data, you can make smart adjustments to your lifestyle to support long-term recovery.
Understanding Your REM Sleep Graph and Deep Sleep Architecture
Analyzing your sleep stages reveals the distinct roles that deep and REM sleep play in your recovery.
A detailed sleep stages graph shows exactly how long you spend in each of these vital phases.
Deep sleep is concentrated heavily in the first few hours of the night to focus on physical healing.
REM sleep periods grow longer toward the morning hours to support mental clarity and cognitive health.
Missing out on either stage can leave you feeling physically exhausted or mentally foggy the next day.
Optical sensors in modern wearables track these sleep stages by measuring blood flow and movement.
The sensors emit specific wavelengths of light through the skin to measure heart rate, respiration, and blood oxygen levels.
A dip in blood oxygen (SpO2) combined with erratic breathing often points to a transition into REM sleep.
Sustained, rhythmic breathing and a stable heart rate typically indicate that you have entered deep slow-wave sleep.
Using a sleep stages diagram makes it easy to visualize these physiological changes over time.
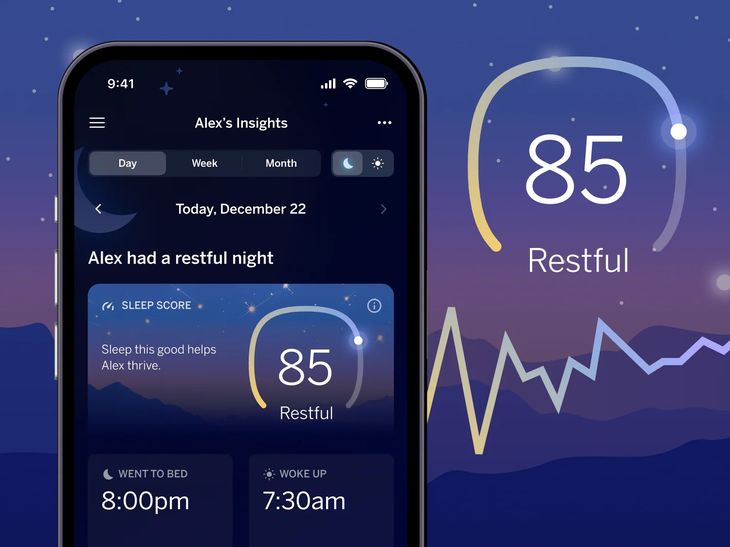
Tracking your daily sleep score helps you see how these phases come together to create a restorative night.
By watching these trends, you can spot subtle disruptions before they turn into chronic sleep issues.
This consistent, data-driven approach takes the guesswork out of improving your nightly rest.
With these clear insights, you can take practical steps to protect both your physical and mental energy.
How to Apply Sleep Graph Metrics to Improve Your Daily Readiness
Your sleep data is most valuable when you use it to guide your daily choices and physical training.
By reviewing your daily daily readiness score, you can plan your day’s physical and mental intensity.
This score combines sleep duration, resting heart rate, and heart rate variability to assess your recovery.
If your readiness score is low, it is usually best to focus on active recovery instead of intense workouts.
Paying attention to these daily indicators helps prevent chronic overtraining and reduces physical stress.
To plan your recovery effectively, it is helpful to look at all your readiness contributors side by side.
Checking your stress resilience score helps you see how daytime pressure impacts your sleep quality.
High daytime stress can keep your heart rate elevated, preventing you from falling into deep sleep.
If you notice a sudden drop in your sleep quality, try using a sleep debt tracker app to find the cause.
This tool helps you see how much sleep you have missed over the past week.
Learning how to calculate sleep debt lets you take action to catch up on rest before fatigue sets in.
You can adjust your evening schedule to gradually pay down this sleep debt and restore your energy.
As your sleep patterns improve, you will likely see a steady rise in your daytime activity score.
This balance of physical exertion and deliberate rest creates a sustainable habit of high performance.
By trusting these biometric trends, you can build a lifestyle that supports long-term health and vitality.
Overcoming Common Sleep Tracking Risks and Hardware Pitfalls
Many people find that wearing a bulky smartwatch to bed is uncomfortable and disrupts their natural sleep.
Heavy wrist-worn devices can easily shift during the night, leading to inaccurate readings and data gaps.
A lightweight smart ring offers a much more comfortable alternative for consistent, round-the-clock tracking.
By fitting comfortably around your finger, it stays securely in place to provide reliable biometric data.
This simple design change helps you track your sleep naturally without any extra discomfort.
Another common frustration is the hidden cost of monthly subscriptions required by many fitness trackers.
These ongoing fees can quickly add up, locking your personal health data behind a paywall.
Team Herz P1 believes you should own your health data outright, which is why our companion app is free for life.
You get full access to detailed sleep graphs, HRV trends, and daily readiness scores with no recurring costs.
This transparent model ensures you can monitor your long-term health goals without any financial surprises.
Frequently Asked Questions About Sleep Graphs and Wearable Tech
Is the Herz P1 Smart Ring waterproof?
Yes, the Herz P1 is fully IP68 waterproof and rated for depths up to 164 feet (50 meters).
You can confidently wear it while swimming, showering, washing your hands, or during high-intensity workouts.
Its military-grade steel casing ensures the internal sensors are protected from water damage in any environment.
How long does the Herz P1 battery last on a single charge?
The Herz P1 battery lasts up to 6 days under normal, continuous tracking conditions.
It charges quickly from zero to one hundred percent in under 1 hour using the included charger.
This long battery life means you spend more time tracking your health and less time waiting for a charge.
Which finger is best to wear the Herz P1 Smart Ring on?
For the most accurate biometric readings, we recommend wearing the ring on your index, middle, or ring finger.
Make sure the ring fits snugly but comfortably without spinning too easily around your finger.
The blood vessels in these fingers are close to the skin, which helps the sensors capture high-quality heart rate data.
Does the Herz P1 store health data offline if my phone is disconnected?
Yes, the ring has secure built-in memory that can store up to 7 days of biometric data offline.
Your data is safely saved on the ring even if your phone is out of Bluetooth range or in airplane mode.
Once you reconnect to the app, all your offline data syncs automatically to update your charts.
90-Day 100% Money-Back Guarantee
“The Herz Smart Ring helps me manage stress easily. It’s accurate, stylish, and lightweight—perfect for my busy life!”
— Jennifer P. | ✔ Verified Customer
- ✓ 6-Day Battery Life
- ✓ Detailed Sleep Analysis
- ✓ Fast 1-Hour Charging
- ✓ iOS & Android Ready
Questions? Call: 1-866-479-1629
Conclusion
Understanding your daily sleep graph is the first step toward improving your health and overall quality of life.
With precise, continuous monitoring, the Herz P1 Smart Ring makes it easy to track and improve your recovery every day.
Ready to monitor your health every day? Explore the Herz P1 Smart Ring and see if it fits your lifestyle. Call: 1-866-479-1629 — our team can help you advise on the correct ring size and set personalized health goals.
Note: Individual results may vary depending on individual health conditions, age, and lifestyle habits. This article is intended for general health reference purposes only.
