

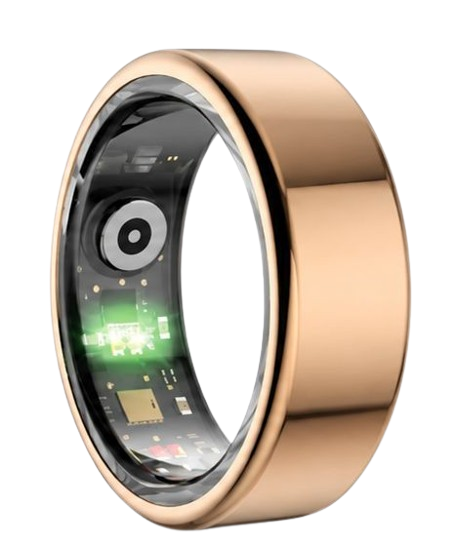
Determining your personal hrv rmssd normal range is the first step toward decoding your body’s daily recovery, stress tolerance, and autonomic nervous system health. The Herz P1 Smart Ring provides real-time, medical-grade biometric tracking to help you understand these metrics clearly. By analyzing these critical values, you can easily discover how your body reacts to daily stressors and overnight recovery phases.
Built to Last. Save Up to 69% Today.
The Herz P1 Smart Ring tracks HRV, Sleep, Heart Rate & SpO2 around the clock. No subscriptions. No renewals. Ever.
In This Article
- Discover how to track and establish your personal RMSSD baseline step-by-step.
- Deconstruct the deep science of RMSSD and the heart rate variability milliseconds meaning.
- Analyze complete, clinical age and gender reference charts for hrv rmssd normal ranges.
- Understand the essential structural differences between RMSSD and SDNN metrics.
- Implement actionable daily lifestyle modifications to systematically optimize your HRV scores.
How to Track and Establish Your Personal HRV RMSSD Baseline: A Step-by-Step Guide
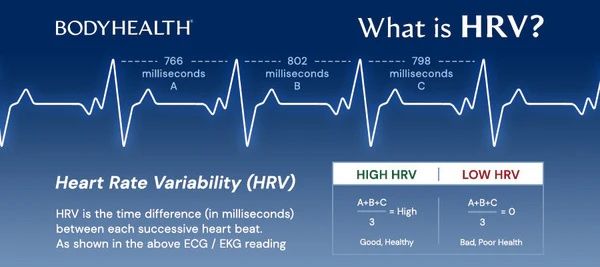
Establishing an accurate physiological baseline requires a structured approach and consistent tracking tools.
Before beginning, you will need a reliable biometric tracking device capable of capturing continuous optical photoplethysmography data.
Ensure that your device is fully charged and that you have downloaded the corresponding, subscription-free companion software.
Step 1: Commit to Consistent Overnight Tracking
Your autonomic nervous system fluctuates naturally throughout the day based on physical movement, emotional stress, and digestive processes.
Measuring your heart rate variability during sleep is the absolute gold standard for establishing a reliable baseline.
The heart rate variability milliseconds recorded during your sleeping hours are free from conscious emotional bias.
When you sleep, your parasympathetic nervous system dominates to rebuild tissues and consolidate memories.
This quiet state allows biometric sensors to read your micro-vessel blood flow with extreme precision.
You should wear your tracking device on the same finger every night to maintain consistent sensor contact.
Inconsistent wear habits can introduce data anomalies that skew your weekly average scores.
A secure fit prevents ambient light from entering the sensor housing and disrupting the photoplethysmography readings.
Keep your device charged above twenty percent to ensure it logs data through the entire night.
Consistent nightly tracking is the foundational pillar of any successful physiological monitoring protocol.
Step 2: Maintain Standardized Measurement Conditions
Establishing a true baseline requires you to control as many external environmental factors as possible.
Keep your bedroom temperature moderately cool to prevent heat-induced cardiovascular strain during sleep.
A room temperature between sixty and sixty-seven degrees Fahrenheit is ideal for deep autonomic recovery.
You should avoid consuming large meals within three hours of going to bed.
Digestion forces blood to pool in your gastrointestinal tract, which temporarily lowers your overnight recovery metrics.
Alcohol consumption is another major variable that heavily suppresses parasympathetic activity.
Even a single drink can cause your resting heart rate to rise and your RMSSD score to plummet.
Try to wake up at a similar time every morning to align with your natural circadian rhythm.
Your body anticipates waking by releasing cortisol, which naturally shifts your variable heart rate metrics.
Minimizing these daily lifestyle variables is the easiest way to ensure your tracked data remains highly accurate.
Step 3: Analyze Your Seven-Day Rolling Average
A single isolated RMSSD reading does not provide enough context to make meaningful lifestyle adjustments.
Your autonomic nervous system is highly dynamic and reacts to microscopic changes in your environment.
You must calculate a seven-day rolling average to understand your true physiological baseline.
This rolling average smooths out daily statistical noise caused by temporary stressors.
If your daily score falls within ten percent of your weekly average, your body is in a balanced state.
Understanding how is hrv calculated helps you appreciate the mathematical stability of a rolling average.
Most digital health platforms automatically calculate this trend line to save you from manual calculations.
You should pay closer attention to the direction of the trend line rather than individual daily spikes.
A steady upward trend indicates improving cardiovascular health and superior physical recovery capacity.
Conversely, a prolonged downward trend suggests accumulated systemic fatigue that requires immediate attention.
Step 4: Identify and Log External Lifestyle Variables
Your daily habits act as direct inputs that shape your overnight recovery scores.
You must actively connect your daily activities with your nightly biometric outcomes to find patterns.
Keep a simple digital journal of your exercise intensity, work stress levels, and subjective sleep quality.
High-intensity training sessions will temporarily suppress your RMSSD score for twenty-four to forty-eight hours.
Psychological stress from a demanding workday can linger in your nervous system long after you close your eyes.
Logging these events allows you to see exactly which habits drive your metrics up or down.
You will eventually identify your personal triggers for poor sleep and slow recovery.
For example, you might notice that late-night screen use consistently delays your deep sleep onset.
This self-awareness is critical for making targeted, high-impact changes to your daily routine.
Data without context is merely noise, but paired with behavioral logs, it becomes an actionable roadmap.
Step 5: Adjust Daily Physical and Mental Loads
The ultimate goal of tracking your baseline is to make smarter decisions about your daily energy expenditure.
When your RMSSD score is exceptionally high, your autonomic nervous system is fully primed for challenges.
This is the perfect day to attempt a heavy workout, tackle a complex project, or learn a new skill.
If your daily score is significantly below your baseline, your body is signaling a need for active recovery.
On low-recovery days, you should substitute intense workouts with light walking, yoga, or stretching.
For instance, seeing a low score like hrv 30 indicates that your cardiovascular system is currently under stress.
Forcing yourself through high-intensity training on low-recovery days can lead to chronic overtraining syndrome.
It can also suppress your immune system and make you highly susceptible to seasonal illnesses.
Listening to these physiological signals allows you to train smarter and avoid unnecessary physical setbacks.
Over time, this adaptive approach to physical loading will systematically elevate your overall health baseline.
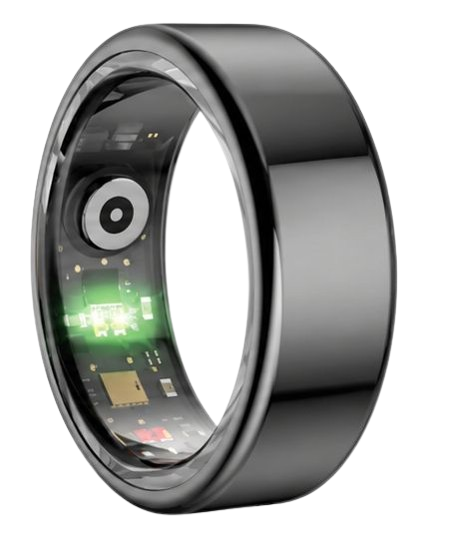
The Herz P1 Smart Ring integrates seamlessly into this daily optimization workflow.
Its advanced multi-wavelength optical sensors track your biometric trends with medical-grade precision.
All of this rich physiological data is delivered directly to your companion app without any hidden subscription walls.
By wearing this ultra-lightweight ring, you can effortlessly monitor your progress and make informed decisions every single day.
Take control of your health journey by exploring the Herz P1 Smart Ring today.
90-Day 100% Money-Back Guarantee
“The Herz Smart Ring helps me manage stress easily. It’s accurate, stylish, and lightweight—perfect for my busy life!”
— Jennifer P. | ✔ Verified Customer
- ✓ 6-Day Battery Life
- ✓ Detailed Sleep Analysis
- ✓ Fast 1-Hour Charging
- ✓ iOS & Android Ready
Questions? Call: 1-866-479-1629
Demystifying RMSSD: The Science Behind Heart Rate Variability Milliseconds
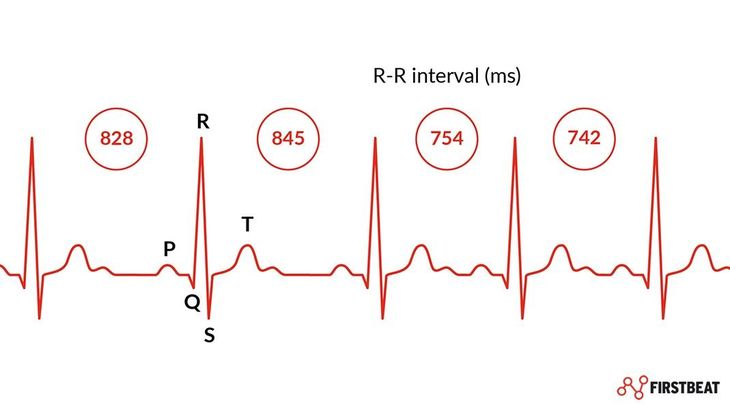
Heart rate variability is not simply the average number of beats per minute.
Instead, it measures the microscopic, constant changes in time between each consecutive heartbeat.
This time interval is measured in milliseconds to capture the subtle, rapid rhythms of your heart.
The Root Mean Square of Successive Differences, or RMSSD, is the primary mathematical formula used to quantify these variations.
Specifically, RMSSD focuses on high-frequency heart rate variations, which are directly controlled by your vagus nerve.
The vagus nerve is the main highway of your parasympathetic nervous system, responsible for rest, digestion, and recovery.
Therefore, a higher RMSSD score indicates strong parasympathetic activity and excellent autonomic recovery capacity.
According to research highlighted by the American Heart Association, tracking these subtle shifts offers deep insights into cardiovascular health.
When your body is under physical or emotional stress, the sympathetic nervous system takes over and makes the heartbeat intervals highly regular.
This rigid, regular pattern results in a much lower RMSSD score, signaling that your body is working hard to maintain internal balance.
To understand your unique scores, it is highly helpful to look at an hrv scale to see how you compare to global averages.
Clinical studies show that RMSSD is highly resistant to minor breathing rate changes during sleep, making it an exceptionally stable metric.
Unlike other mathematical models, RMSSD can be calculated over very short timeframes, such as a simple five-minute window.
This rapid calculation capability makes it perfect for continuous, non-invasive monitoring via modern wearable health technology.
Understanding what does hrv tell you allows you to look past raw numbers and focus on true, systemic recovery trends.
Understanding HRV RMSSD Normal Ranges by Age and Gender
There is no single universal number that represents a perfect RMSSD score for everyone.
Your personal hrv rmssd normal range is highly unique and influenced by genetics, age, and biological sex.
As we age, our autonomic nervous system naturally loses some of its flexibility, causing average scores to decline gradually.
Younger adults in their twenties often show average overnight RMSSD scores between fifty and eighty milliseconds.
By the time we reach our fifties, typical normal ranges shift down to twenty to forty-five milliseconds.
Biological sex also plays a role, with men typically showing slightly higher raw RMSSD values than women in younger age cohorts.
However, these gender differences tend to equalize as we reach middle age and older adulthood.
It is vital to avoid comparing your raw scores with friends, family members, or even elite athletes.
An athlete might consistently register scores above one hundred, while a highly active professional might sit around forty.
Both individuals can be in peak health relative to their own personal historical baselines.
To help you contextualize your data, we have compiled a reference table based on clinical cohort studies.
Use this data as a general reference rather than an absolute rule for your daily wellness goals.
| Age Group | Typical Female RMSSD Range (ms) | Typical Male RMSSD Range (ms) |
|---|---|---|
| 20–29 Years | 43 to 76 ms | 47 to 82 ms |
| 30–39 Years | 33 to 62 ms | 35 to 68 ms |
| 40–49 Years | 25 to 50 ms | 27 to 54 ms |
| 50–59 Years | 19 to 38 ms | 20 to 41 ms |
| 60–69 Years | 15 to 30 ms | 16 to 32 ms |
The Critical Differences: RMSSD vs. SDNN
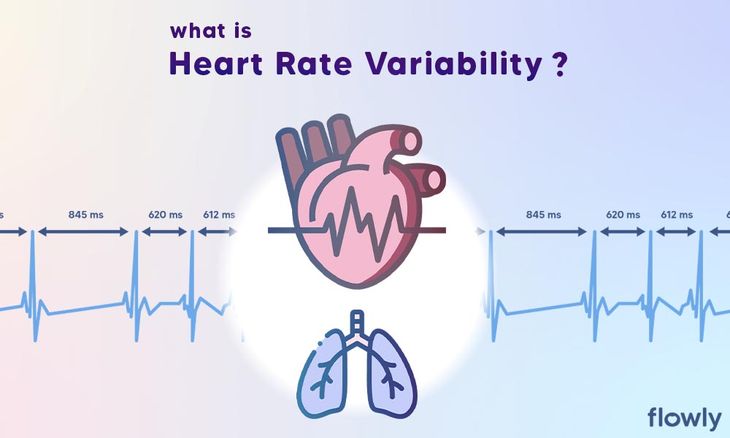
When exploring heart rate variability, you will likely encounter multiple statistical metrics besides RMSSD.
The most common alternative metric is SDNN, which stands for the Standard Deviation of Normal-to-Normal intervals.
While RMSSD measures short-term, beat-to-beat changes, SDNN looks at the overall variance across an entire twenty-four-hour period.
This makes SDNN highly sensitive to long-term circadian rhythms and slower physiological changes.
Conversely, RMSSD is the superior metric for tracking immediate parasympathetic nervous system recovery.
If you want to know how well your body recovered from yesterday’s stress, RMSSD is the most reliable metric.
If you are tracking overall cardiovascular health trends over several months, SDNN is highly informative.
To get a complete picture of your health, you should also look into the hrv sdrr normal range for additional context.
Some users get discouraged when they see a daily recovery score like hrv 50 on their dashboard.
It is crucial to remember that a score of fifty might represent excellent recovery for a fifty-year-old individual.
In contrast, that same score of fifty might indicate mild fatigue or dehydration for a twenty-five-year-old.
Always analyze your metrics through the lens of your age, fitness level, and historical trends.
Wearable technology like the Herz P1 tracks these distinct metrics automatically during your sleep.
This continuous monitoring ensures you receive a comprehensive, multi-dimensional view of your nervous system.
Armed with this knowledge, you can systematically optimize your recovery and avoid burnout.
Practical Applications: How to Leverage Your Herz P1 RMSSD Data
Tracking your data is only half the battle; the real value lies in practical lifestyle application.
The Herz P1 companion app displays your RMSSD scores and daily Stress Index in intuitive, easy-to-read charts.
Every morning, take a quick look at your overnight recovery score before planning your daily workout or work tasks.
If your score is elevated, you can confidently push your physical boundaries with high-intensity interval training.
If your score is low, prioritize active recovery strategies like meditation, deep breathing, or early sleep.
To systematically improve your baseline RMSSD, focus on high-quality sleep hygiene.
Keep your sleeping environment dark, quiet, and cool to encourage prolonged periods of deep sleep.
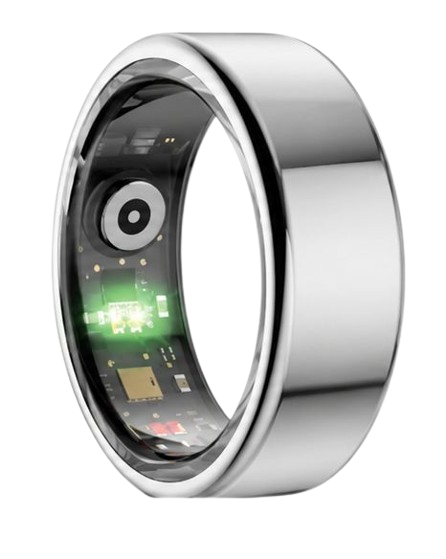
The Herz P1 is incredibly lightweight and crafted from sleek, hypoallergenic, military-grade materials.
Unlike bulky, heavy smartwatches that trap sweat and disturb your sleep, this smart ring is practically unnoticeable on your finger.
This lightweight design ensures comfortable, continuous twenty-four-seven wear for highly accurate trend tracking.
Additionally, practicing structured box breathing for just five minutes before bed can significantly boost your overnight RMSSD.
Consistently avoiding blue light exposure from screens in the evening will also yield immediate positive changes in your metrics.
By making these small, data-informed adjustments, you will notice a steady upward climb in your overall recovery capacity.
Remember that long-term consistency is far more powerful than temporary, extreme lifestyle changes.
Avoidable Pitfalls: Misinterpreting HRV RMSSD Scores
Many people make the fundamental mistake of trying to track overnight sleep and recovery using a bulky smartwatch.
Heavy wrist-worn devices often shift during the night, leading to sensor misalignment and highly inaccurate readings.
Furthermore, the physical discomfort of a thick watch band can cause micro-arousals that disrupt your deep sleep cycles.
Another massive pitfall in the wearable market is the hidden financial burden of ongoing monthly subscriptions.
Many premium brands require you to pay a recurring monthly fee just to access your own biometric data.
This practice forces users into a frustrating monthly cycle of paying for hardware they already bought.
Team Herz P1 believes that your personal health data should belong to you entirely without financial barriers.
The Herz P1 App is completely free for a lifetime, with no locked features, premium tiers, or hidden renewals.
You get full, unrestricted access to your sleep stages, continuous SpO2 tracking, and daily RMSSD averages forever.
By choosing a subscription-free smart ring, you protect both your physiological health and your hard-earned finances.
Additionally, make sure to wear your ring on the recommended index or middle finger for the most stable readings.
Wearing a ring that is too loose will cause it to rotate, resulting in gaps in your overnight data graphs.
Correcting these simple mistakes will instantly elevate the quality and reliability of your biometric tracking experience.
Frequently Asked Questions About HRV and RMSSD
Is the Herz P1 Smart Ring waterproof?
Yes, the Herz P1 features a certified IP68 waterproof rating.
This military-grade engineering allows the ring to be safely submerged up to one hundred and sixty-four feet.
You can confidently wear it while swimming, showering, washing your hands, or relaxing in a hot tub.
There is absolutely no need to remove the ring during water-based workouts or daily household chores.
How long does the Herz P1 battery last on a single charge?
The high-capacity battery of the Herz P1 lasts up to six full days under standard continuous tracking.
It utilizes advanced low-energy Bluetooth protocols to transmit data efficiently to your smartphone.
When the battery eventually runs low, it charges from zero to one hundred percent in under one hour.
This rapid charging capability means you will rarely experience gaps in your daily health monitoring.
Which finger is best to wear the Herz P1 on?
We highly recommend wearing the Herz P1 on your index or middle finger of either hand.
These fingers have prominent blood vessels near the skin surface, which optimizes the accuracy of the optical sensors.
Ensure the ring fits snugly but comfortably without rotating excessively during daily movements.
A proper fit is the most critical factor for gathering clean, uninterrupted physiological data.
Does the Herz P1 store health data offline?
Yes, the Herz P1 has built-in memory that securely stores up to seven days of local health data offline.
You do not need to keep your smartphone nearby or connected to Bluetooth twenty-four hours a day.
Once you open the companion app near your ring, all stored data will sync automatically and seamlessly.
This local storage capacity is ideal for travelers, outdoor adventurers, or those who prefer to unplug.
Conclusion: Your Advanced Autonomic Recovery Roadmap
Tracking your hrv rmssd normal range is key to mastering recovery and stress. The subscription-free Herz P1 Smart Ring is your ultimate health companion. Ready to monitor your health every day? Explore the Herz P1 Smart Ring and see if it fits your lifestyle. Call: 1-866-479-1629 — our team can advise on ring sizes and set health goals.
