

Decoding your nocturnal metrics can feel like translating an ancient language, but learning how to read sleep graphs on your mobile app is the ultimate key to unlocking peak daytime performance. The premium, subscription-free Herz P1 Smart Ring tracks your heart rate, HRV, and oxygen saturation to turn confusing lines into a clear roadmap for recovery. We will show you exactly how to analyze your sleep cycles, identify disruptions, and optimize your sleep hygiene without any expensive monthly fees.
Built to Last. Save Up to 69% Today.
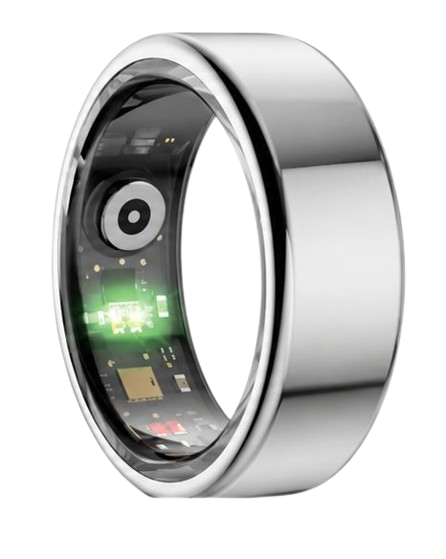
The Herz P1 Smart Ring tracks HRV, Sleep, Heart Rate & SpO2 around the clock. No subscriptions. No renewals. Ever.
In This Article
- Learn exactly how to read sleep graphs with our simple, scientific steps.
- Discover the critical differences between deep and light sleep stages.
- Uncover what your average awake time actually means for your health.
- Compare the best tracking options on the market without paying subscription fees.
How to Read Sleep Graphs on Your Smart Ring: A Step-by-Step Guide
To accurately interpret your nighttime biometric trends, you need a high-precision smart ring and its companion app.
You should wear your smart ring consistently for at least three consecutive nights to establish a reliable baseline.
Ensure your device is fully charged and securely positioned on your chosen finger before going to sleep.
Step 1: Open Your Wearable’s Companion Application
Begin by launching the sleep analytics dashboard on your smartphone first thing in the morning.
Allow the device to sync all recorded nighttime data points via Bluetooth.
Look at the primary screen to locate your overall sleep score for the previous night.
This score serves as a quick snapshot of your recovery before you dive deeper into the graphs.
Ensure your phone’s wireless connection is stable during the synchronization process to prevent errors.
Keep your smart ring within three feet of your smartphone for the fastest data transfer speeds.
Step 2: Identify the Stages of Your Sleep Cycle Chart
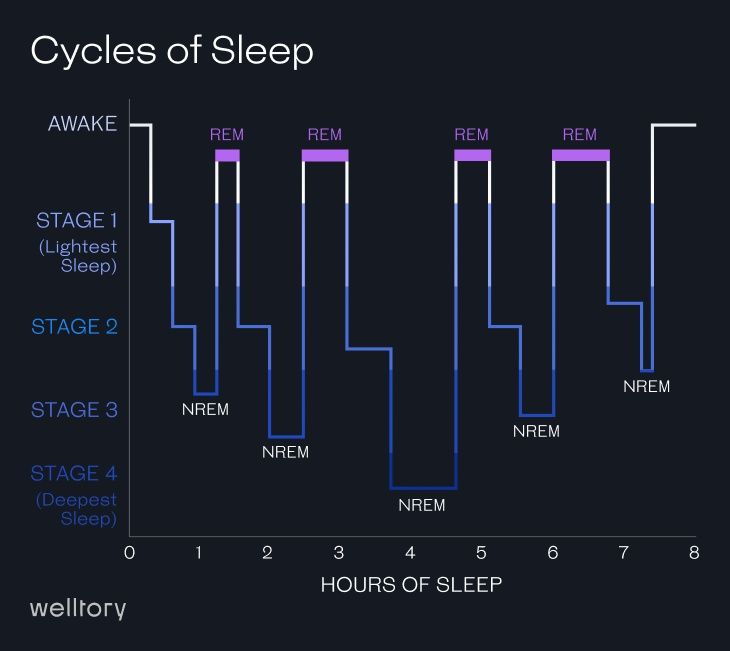
Locate the primary hypnogram, which is the visual timeline mapping your sleep stages over the course of the night.
Look for the distinct horizontal bands that represent light, deep, and REM sleep cycles on your sleep cycle chart.
The vertical axis typically indicates the depth of sleep, with awake time sitting at the very top.
Identify the deep sleep valleys, which should appear primarily during the first half of your night.
Confirm that your REM sleep peaks are concentrated more heavily during the second half of the night.
Pay attention to the color-coded segments that visually break down your time spent in NREM stages.
Step 3: Analyze the Frequency and Duration of Awakenings
Scan the top baseline of your sleep stages diagram for vertical red or orange spikes.
These spikes indicate conscious or unconscious awakenings during your sleep period.
Count the total number of times your body transitioned back into an awake state.
A healthy graph will show several brief micro-arousals that you might not even remember.
If these spikes are prolonged or frequent, they suggest that your sleep environment is too noisy, hot, or bright.
Note if these awakenings happen at the same time each night to identify environmental patterns.
Step 4: Check Your Nighttime Heart Rate and HRV Patterns
Scroll down to the cardiovascular metrics section located below the primary sleep graph.
Look for a classic hammock-shaped curve in your overnight heart rate graph.
Your heart rate should ideally drop to its lowest point during the middle of your sleep cycle.
Analyze your Heart Rate Variability (HRV) graph to ensure your autonomic nervous system is relaxing.
A rising HRV trend throughout the night indicates excellent recovery and low physiological stress.
Compare this resting rate to your normal baseline to see if your body is carrying lingering physical fatigue.
Step 5: Review Oxygen Saturation and Breathing Stability
Examine the blood oxygen saturation (SpO2) graph to check for nighttime respiratory consistency.
Your baseline SpO2 levels should ideally remain stable between ninety-five and one hundred percent.
Identify any sudden, sharp downward dips in the oxygen saturation graph.
Frequent dips below ninety-two percent can indicate restricted airflow or poor room ventilation.
Correcting your sleeping position or improving bedroom air quality can quickly stabilize this graph.
Keep track of these breathing indicators to identify potential sensitivities to seasonal airborne allergens.
Step 6: Log Daily Habits to Identify Biometric Patterns
Utilize the tag or notes feature in your app to log activities from the previous day.
Note specific variables such as late-night meals, intense evening workouts, or alcohol consumption.
Compare these lifestyle tags against the resulting deep sleep and HRV graphs over several weeks.
You will soon notice clear patterns showing exactly how daily choices dictate your recovery.
This active tracking helps you systematically eliminate habits that ruin your sleep quality.
Consistency in logging habits is the true secret to turning raw biometric data into life-changing habits.
The premium Herz P1 Smart Ring streamlines this entire multi-step analysis by automatically compiling your heart rate, sleep stages, and oxygen levels into one intuitive dashboard.
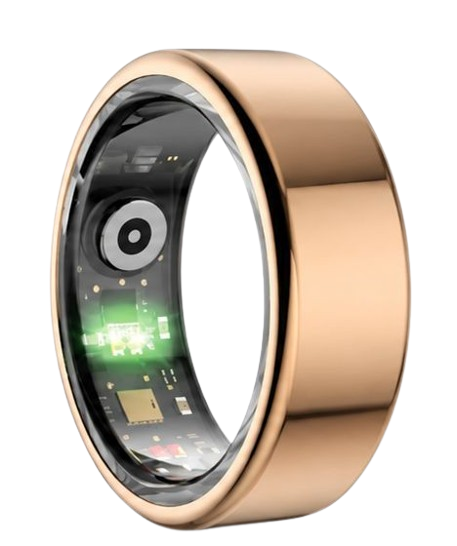
Our military-grade steel ring tracks these complex metrics continuously without requiring a paid subscription to access your data.
90-Day 100% Money-Back Guarantee
“The Herz Smart Ring helps me manage stress easily. It’s accurate, stylish, and lightweight—perfect for my busy life!”
— Jennifer P. | ✔ Verified Customer
- ✓ 6-Day Battery Life
- ✓ Detailed Sleep Analysis
- ✓ Fast 1-Hour Charging
- ✓ iOS & Android Ready
Questions? Call: 1-866-479-1629
Understanding Sleep Architecture: What a Healthy Sleep Stages Graph Looks Like
A normal night of sleep consists of four to six repeating cycles that last roughly ninety minutes each.
Each cycle transitions through distinct stages, starting with light NREM sleep and progressing into deep NREM sleep before entering REM sleep.
Understanding the balance of deep sleep vs light sleep is essential for mapping your overall restoration.
Deep sleep is the physical repair phase where your muscles heal, tissues grow, and immune cells regenerate.
This stage is characterized by slow delta brainwaves and a significant drop in blood pressure.
If you wake up feeling physically sore or sluggish, your sleep stages graph might show a lack of deep sleep.
You can discover practical methods on how to get longer deep sleep to maximize this critical recovery phase.
Light sleep makes up about half of your total sleep time and acts as a transition phase between deeper states.
During light sleep, your heart rate slows down and your core body temperature begins to drop.
REM sleep is the mental restoration phase where dreaming occurs, memories are consolidated, and emotions are processed.
During REM, your brain activity rises to near-waking levels while your skeletal muscles are temporarily paralyzed.
A healthy sleep stages diagram will show longer REM periods occurring during the early morning hours.
The National Sleep Foundation states that a healthy adult should spend roughly twenty to twenty-five percent of their night in REM sleep.
Similarly, deep sleep should ideally make up about fifteen to twenty percent of your total sleeping time.
If your sleep stages diagram shows a significant skew, it may indicate a disruption in your natural circadian rhythms.
Decoding Micro-Arousals and Finding the Average Awake Time During Sleep

Many people are shocked to see frequent brief awake moments on their sleep stages diagram.
It is entirely normal to experience micro-arousals as your body shifts positions between cycles.
The typical average awake time during sleep ranges from thirty minutes to nearly an hour per night.
These brief moments are usually forgotten by morning because they last only a few seconds.
However, if your awake periods are prolonged or frequent, your sleep efficiency score will plummet.
This fragmentation often occurs due to elevated stress, nighttime breathing issues, or external disturbances.
Many wellness enthusiasts are exploring mouth taping for sleep to encourage nasal breathing and reduce dry-mouth awakenings.
Keeping your bedroom temperature below sixty-eight degrees Fahrenheit also prevents heat-related nighttime awakenings.
By tracking these awake spikes, you can pinpoint exactly what is interrupting your biological rhythm.
Elevated cortisol levels due to work stress can cause sudden awakenings during the early hours of three or four in the morning.
These stress-induced spikes are often accompanied by a sudden jump in your overnight heart rate line.
Using your smart ring sleep stages graph lets you trace these interruptions back to their physiological root causes.
Over time, minimizing these awake spikes will lead to a dramatic improvement in your morning alertness and mood.
How Your Sleep Cycle Healthy Graph Should Look: A Benchmark Guide

A perfectly optimized sleep cycle healthy graph looks like a series of clean, rolling waves.
These waves should plunge deeply into slow-wave sleep during your first two cycles of the night.
After midnight, the valleys should become shallower as light sleep and REM sleep take over.
The transitions between NREM and REM stages should appear smooth and gradual without jagged spikes.
If you see a highly fragmented pattern, your body is struggle to complete full cycles.
This lack of cycle completion often leaves you feeling exhausted, even after eight hours in bed.
Paying attention to your personal chronotype can help you schedule your bedtime to match these natural waves.
When you align your sleep schedule with your internal clock, the shapes of your waves will improve dramatically.
A stable graph is the ultimate biological proof that your nervous system is recovering perfectly.
Choosing the Best Smart Ring for Sleep Tracking: Skip the Monthly Subscription Fees
Bulky smartwatches can be incredibly uncomfortable to wear to bed, often causing wrist sweat and irritation.
Smart rings solve this comfort issue by packing advanced optical sensors into a lightweight, slim band.
When researching the best smart ring for sleep tracking, sensor placement is highly critical.
The blood vessels in your fingers are much closer to the surface than the blood vessels in your wrist.
This anatomical advantage allows optical sensors on a ring to capture incredibly clean heart rate and SpO2 signals.
A premium ring will utilize red, green, and infrared LEDs to measure your biometrics with medical-grade precision.
Many of the best sleep tracker rings provide detailed data but require a recurring monthly subscription.
These hidden fees can easily add hundreds of dollars to the total lifetime cost of your device.
Furthermore, some users find themselves locked out of their own historical data if they cancel their subscriptions.
If you prefer to avoid ongoing payments, you might look at an alternative like the Herz P1 rather than a subscription-dependent oura sleep graph.
The Herz P1 Smart Ring delivers this identical high-end biometric analysis without any hidden paywalls or ongoing fees.
Our companion application provides full, unrestricted access to your historical sleep cycle charts and recovery trends forever.
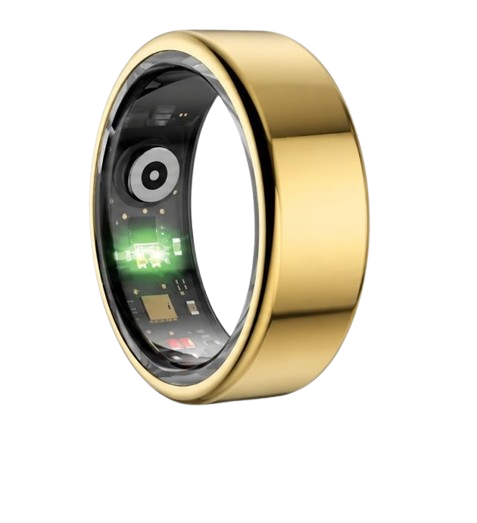
We build our rings with military-grade steel to ensure they easily survive accidental bumps and everyday wear.
This combination of durable hardware and open-access software makes tracking your sleep a completely worry-free experience.
How to Use Your Smart Ring Sleep Graph to Optimize Your Days
Your overnight biometrics provide a clear, objective snapshot of your nervous system’s recovery state.
If your sleep stages diagram shows a healthy balance of deep and REM sleep, your body is ready for high-intensity training.
A low deep sleep score combined with a depressed HRV indicates that your body is still actively recovering.
On these low-recovery days, you should pivot to light active recovery or gentle yoga instead of heavy lifting.
You can also use your sleep graph to determine your optimal bedtime window based on actual physiological patterns.
If you go to bed too late, you will notice a sharp reduction in your early-night deep sleep valleys.
Caffeine consumed after two in the afternoon will often show up as elevated heart rate lines on your overnight chart.
Alcohol consumption typically suppresses REM sleep, leaving your morning graph looking completely flat in those sections.
By matching your daily choices with your biometric feedback, you can build a highly personalized recovery routine.
This scientific approach takes the guesswork out of lifestyle changes and guarantees measurable progress.
You will no longer rely on how you think you slept when you have cold, hard data guiding your mornings.
This daily alignment of activity with recovery is the foundation of peak long-term health and performance.
Common Mistakes to Avoid in Smart Ring Sleep Tracking
Wearing a smart ring that is too loose will cause the optical sensors to lose contact with your skin.
This poor fit results in missing gaps and highly inaccurate readings on your overnight sleep graphs.
Choose a size that fits snugly at the base of your finger but can still slide over your knuckle with light resistance.
Another common mistake is charging your smart ring overnight, which completely defeats the purpose of sleep tracking.
The Herz P1 charges fully in under an hour, allowing you to top up the battery while showering or washing dishes.
Many consumers also get trapped in expensive subscription cycles with other wearable brands just to view their own metrics.
The Herz P1 app is completely free for life, protecting you from sneaky recurring monthly credit card charges.
Finally, avoid obsessing over every single minor dip in your sleep scores to prevent unnecessary nighttime anxiety.
Focus on long-term weekly and monthly trends rather than stressing over a single bad night of recovery.
This psychological phenomenon is known as orthosomnia, where the fear of bad sleep data actively prevents restful sleep.
Use your smart ring as a gentle guide to overall wellness, not as a source of rigid perfectionist pressure.
Frequently Asked Questions
Is the Herz P1 Smart Ring waterproof?
Yes, the Herz P1 features a certified IP68 waterproof rating for worry-free use in wet environments.
This design makes the ring completely safe for swimming, showering, bathing, and intensive handwashing.
Our military-grade steel construction allows the ring to resist water pressure at depths of up to one hundred and sixty-four feet.
How long does the battery last and how quickly does it charge?
The Herz P1 battery lasts up to six full days on a single charge under normal operating conditions.
This long lifespan is made possible by our highly efficient optical sensors and low-energy Bluetooth transmitter.
The device charges from zero to one hundred percent in under one hour using the included magnetic charging dock.
This rapid charging speed means you can easily top up your battery during your morning shower without missing any sleep data.
Which finger is the best choice to wear my smart ring on?
The index finger of your non-dominant hand is the preferred choice for the highest biometric reading accuracy.
This finger generally contains the most accessible blood vessels near the skin surface for clean PPG sensor signals.
However, the middle or ring fingers are also excellent alternatives as long as the fit remains snug and secure.
Avoid wearing the ring on your pinky finger or thumb, as these positions often suffer from increased movement interference.
Does the Herz P1 store my biometric data offline when not connected to my phone?
Yes, the ring features seven days of secure local storage to keep your data safe without constant phone pairing.
This offline capability is perfect for travelers, campers, or anyone who prefers to turn off their phone at night.
Your recorded biometrics will automatically sync to your mobile application the next time the Bluetooth connection is active.
You never have to worry about losing your valuable historical sleep data due to a temporary lack of wireless connection.
Conclusion
Understanding how to read sleep graphs empowers you to take control of your daily vitality. The Herz P1 Smart Ring makes tracking these biometric shifts effortless, durable, and completely free of subscription costs. Ready to monitor your health every day? Explore the Herz P1 Smart Ring and see if it fits your lifestyle. Call: 1-866-479-1629 — our team can help you advise on the correct ring size and set personalized health goals.
