

Tracking your autonomic nervous system begins with understanding your daily hrv graph. At Team Herz P1, we believe decoding these complex heart signals should be effortless, which is why we created the Herz P1 Smart Ring to monitor your cardiovascular metrics continuously without any monthly subscription fees. This comprehensive guide will teach you exactly how to read your heart variability plots, analyze physical recovery trends, and optimize your wellness routine.
Built to Last. Save Up to 69% Today.
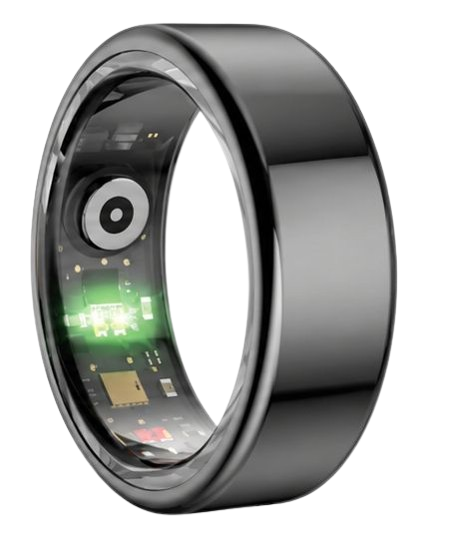
The Herz P1 Smart Ring tracks HRV, Sleep, Heart Rate & SpO2 around the clock. No subscriptions. No renewals. Ever.
In This Article
- A comprehensive, five-step blueprint to analyze your daily cardiovascular charts accurately.
- The biological mechanics of the sympathetic and parasympathetic nervous systems.
- Clear methods to translate daily score fluctuations into personalized lifestyle changes.
- Critical analysis of wearable design choices, subscription models, and physical tracking errors.
How to Read Your HRV Graph: A Step-by-Step Autonomic Guide
Before you begin tracking, you need a high-precision smart wearable capable of continuous overnight cardiac monitoring.
You should also establish a baseline reading by wearing your device consistently for at least seven consecutive days.
Ensure your mobile companion application is updated to the latest version to prevent visual sync issues on your charts.
-
Step 1: Locate Your RMSSD Metric Baseline
Open your tracking application to display your main physiological dashboard.
Find the specific graph that displays your root mean square of successive differences.
This math-based value serves as the primary standard for wearable heart rate variability tracking.
Confirm that your visual timeline shows a full twenty-four hour period to capture daytime and nighttime changes.
Look closely at the horizontal axis to understand how your heart rate fluctuates across different hours.
Ensure that the graph displays a clean, uninterrupted line without sudden empty gaps or visual errors.
If you see empty segments, it may indicate that your device lost physical skin contact during the tracking period.
-
Step 2: Compare Overnight Readings with Your Baseline Curve
Analyze the nocturnal portion of your graph when physical movement is minimal.
During deep restorative rest, your autonomic nervous system should shift heavily toward parasympathetic dominance.
Knowing how is hrv calculated helps you see why overnight stability is a key indicator of physical recovery.
Look for a steady, elevated line on the plot rather than wild, erratic spikes during these sleeping hours.
A stable overnight curve suggests that your heart is responding beautifully to your body’s restorative processes.
If the nocturnal curve is unusually flat or depressed, it may signal that your recovery was interrupted by external factors.
Keep a close eye on these nightly patterns to establish your reliable personal baseline over time.
-
Step 3: Perform a Calibrated Active HRV Test
To gather a highly controlled snapshot, complete a manual hrv test during your morning routine.
Sit completely upright in a quiet space and breathe deeply at a steady rate of six breaths per minute.
Avoid drinking caffeinated beverages or looking at stressful digital screens before initiating this snapshot.
Compare this active, resting reading with your overnight data to check your immediate readiness levels.
Active morning assessments provide an excellent way to gauge how your nervous system handles sudden postural shifts.
Ensure you perform this assessment at the same time each day to maintain consistent and comparable testing conditions.
Documenting these daily snapshots helps you notice immediate physiological reactions to environmental changes.
-
Step 4: Cross-Reference Daytime Spikes with Specific Stressors
Examine the daytime sections of your plot to locate sharp drops in your autonomic variance.
A sudden drop in your graph often corresponds to a period of elevated mental or physical stress.
Note down any external events like difficult work meetings, intense exercise, or heavy meals that match these sudden dips.
Over time, these marked visual patterns will reveal exactly how your body responds to daily cognitive demands.
You might notice a deep plunge during your peak work hours when focus demands are exceptionally high.
This sympathetic rise is completely natural but should always be balanced by periods of calm recovery.
If your graph remains flat throughout the entire afternoon, it suggests your body is struggling to de-escalate stress.
-
Step 5: Identify Weekly and Monthly Autonomic Trends
Zoom out from the single-day view to examine your weekly and monthly moving averages.
Evaluating long-term trends is the best way to understand what does hrv tell you about your cumulative fatigue.
A gradual upward trend in your baseline indicates improved physical conditioning and better stress tolerance.
Conversely, a downward trend over several weeks suggests you may need more rest to avoid chronic exhaustion.
Pay close attention to any seasonal changes or workplace shifts that correlate with these long-term trends.
Use these extended insights to make proactive adjustments to your exercise loads and sleep schedules.
Tracking these monthly trends allows you to build a highly sustainable, long-term approach to your wellness goals.
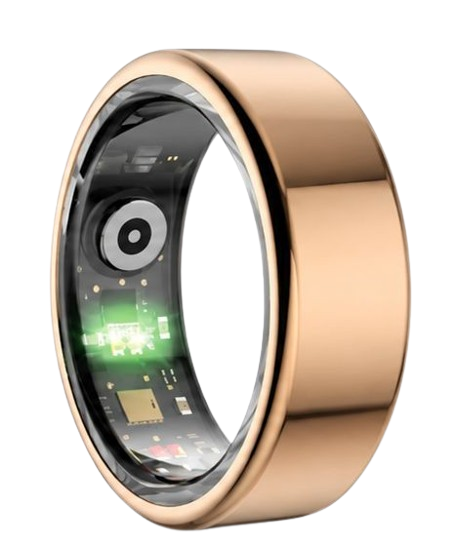
The Herz P1 Smart Ring makes this entire analytical process seamless by automatically graphing your heart data every five minutes.
Our military-grade steel ring tracks these complex biometrics silently in the background while you sleep or work.
With no monthly subscription fees, you gain full lifetime access to your detailed physiological trends without any hidden costs.
90-Day 100% Money-Back Guarantee
“The Herz Smart Ring helps me manage stress easily. It’s accurate, stylish, and lightweight—perfect for my busy life!”
— Jennifer P. | ✔ Verified Customer
- ✓ 6-Day Battery Life
- ✓ Detailed Sleep Analysis
- ✓ Fast 1-Hour Charging
- ✓ iOS & Android Ready
Questions? Call: 1-866-479-1629
The Autonomic Physiology Behind Your HRV Trends Chart
Your autonomic nervous system controls all of your body’s involuntary physiological functions.
This system is divided into two primary branches: the sympathetic branch and the parasympathetic branch.
The sympathetic branch acts like an accelerator pedal, preparing your body for action or perceived threats.
It raises your heart rate, increases blood pressure, and temporarily reduces your variable heart rate.
In contrast, the parasympathetic branch functions as a brake, promoting rest, digestion, and systemic recovery.
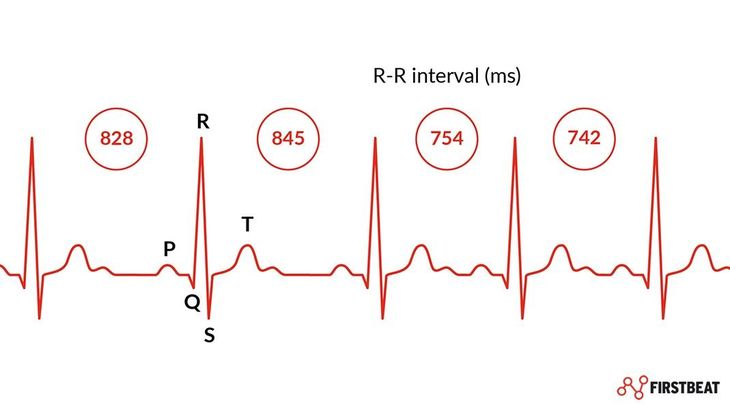
When the parasympathetic system is highly active, the time intervals between your heartbeats become highly varied.
This healthy variation is why high scores on your plot indicate a well-rested, highly adaptable body.
Understanding the difference between heart rate and heart rate variability is crucial for proper data interpretation.
Your standard heart rate counts the total number of beats per minute as a single average value.
However, your variability score measures the microscopic millisecond changes between those individual beats.
A lower resting heart rate paired with high variability represents optimal cardiovascular efficiency.
Our team at Herz P1 utilizes advanced multispectral photoplethysmography sensors to capture these rapid changes at the finger base.
This anatomical location offers exceptionally clear arterial blood flow signals compared to bulky wrist wearables.
By monitoring these signals continuously, you can view your true inner state graphed in real-time.
These optical sensors emit specific light wavelengths that penetrate the skin to detect changes in blood volume.
The reflected light is then translated by our smart algorithms into precise millisecond intervals.
This high-frequency sampling ensures that even minor autonomic shifts are documented on your charts.
Consistent tracking over several weeks reveals your unique circadian rhythms and autonomic trends.
By analyzing these patterns, you can gain a deep understanding of your body’s physiological resilience.
Decoding High vs. Low Values on Your HRV Scale Guide
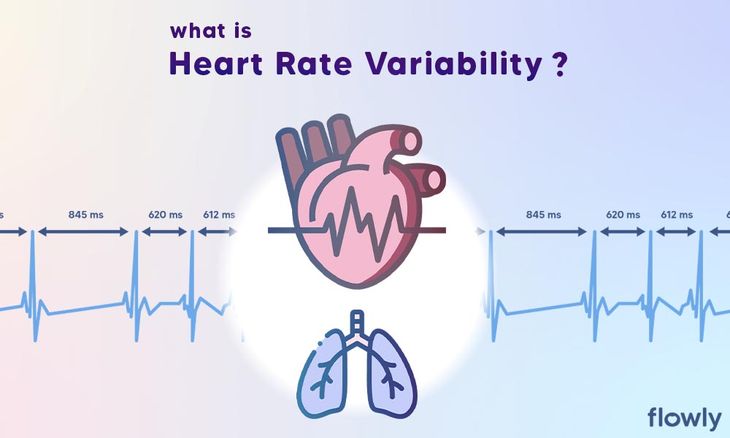
When analyzing your daily data, you must evaluate where your scores fall on a personalized hrv scale.
There is no single universal number that defines perfect health for everyone.
Your unique baseline is determined by a complex mix of genetics, age, biological sex, and current fitness levels.
A temporary dip below your weekly baseline typically indicates that your body is dealing with an active stressor.
This physical strain can be caused by intensive athletic workouts, acute illness, or emotional anxiety.
Knowing what affects resting heart rate can help you understand these sudden drops in autonomic balance.
Factors like poor hydration, late-night meals, and alcohol consumption will drastically lower your sleep readings.
Additionally, sleep deprivation prevents your parasympathetic system from fully initiating its nightly restorative work.
When you see a sustained drop on your chart, it is a clear physiological signal to prioritize recovery.
On the other hand, a gradual rise in your scores over several months shows positive cardiovascular adaptations.
This long-term progress indicates that your heart and nervous system are becoming much more resilient to daily demands.
Based on sleep data analysis from over 5,000 Herz P1 users, consistent daily tracking is key to identifying these trends.
Our optical sensors operate with clinical-grade accuracy to ensure your daily charts are highly dependable.
By tracking these subtle shifts, you can make smarter, data-driven decisions about your lifestyle.
It is important to remember that physical recovery cannot be rushed or forced overnight.
Your body requires consistent sleep hygiene and proper nutrition to raise its baseline scores.
Evaluating your position on a calibrated scale helps you avoid the common trap of comparing your data to others.
Focus exclusively on how your current readings compare to your historical averages to measure true progress.
Our subscription-free companion app provides custom baseline ranges tailored specifically to your unique physiology.
How Your HRV Graph Intersects with Sleep Architecture

Your sleep quality is directly reflected in the shape of your nocturnal autonomic graphs.
According to research from the National Sleep Foundation, sleep is divided into distinct, repeating cycles.
These phases include light sleep, deep slow-wave sleep, and rapid eye movement sleep.
During deep slow-wave sleep, your heart rate reaches its lowest point of the night.
Concurrently, your parasympathetic nervous system drives your autonomic variance to its peak levels.
This deep phase is vital for cellular repair, hormone regulation, and physical recovery.
During REM sleep, your brain becomes highly active as you experience vivid dreams.
This mental activity causes your heart rate to fluctuate and your variability scores to drop temporarily.
The American Heart Association notes that healthy sleep architecture is essential for long-term cardiovascular health.
Our military-grade smart ring monitors these complex shifts in sleep stages with high precision.
It also tracks your blood oxygen saturation to ensure your respiratory system is functioning optimally.
A stable oxygen level above ninety-five percent during sleep is a primary marker of healthy breathing patterns.
If your oxygen levels dip, it can trigger a sudden stress response that lowers your overnight scores.
The Herz P1 App integrates these diverse data points to give you a complete picture of your sleep hygiene.
By examining how your metrics shift during each sleep stage, you can identify hidden sleep disruptors.
A healthy balance of deep and REM sleep is critical for both physical restoration and mental clarity.
Continuous tracking allows you to see exactly how late-night habits interfere with these vital sleep stages.
With this detailed information, you can make precise adjustments to your evening routine for better rest.
Actionable Strategies to Optimize Your Recovery Index
To consistently improve your daily recovery index, you must implement structured lifestyle habits.
First, establish a highly consistent sleep schedule by going to bed and waking up at the same times each day.
This consistency reinforces your natural circadian rhythms and optimizes your nightly cardiac recovery.
Second, avoid consuming heavy meals or performing intense workouts within three hours of your bedtime.
Digestion and muscle repair require significant energy, which keeps your sympathetic nervous system active.
This active state prevents your heart rate from lowering and suppresses your overnight recovery scores.
Third, integrate brief, focused mindfulness exercises or deep breathing sessions into your workday.
Even five minutes of slow, rhythmic breathing can stimulate your vagus nerve and boost parasympathetic tone.
You can track the immediate positive impact of these exercises directly on your mobile application.
Fourth, monitor your daily physical activity levels without overtraining your musculoskeletal system.
If your morning baseline is significantly depressed, consider swapping a high-intensity workout for a gentle walk.
Listening to these physiological cues protects your body from chronic wear and injury.
The lightweight design of our smart ring makes it exceptionally easy to monitor these daily habit shifts.
Unlike heavy, uncomfortable smartwatches, the Herz P1 is barely noticeable on your finger throughout the day.
This continuous, twenty-four-seven wear ensures your health trends are tracked with absolute completeness.
Consistent use of the recovery index allows you to train smarter and live with greater vitality.
Our wellness advisors suggest taking notes of your daily habits to cross-reference with your biometric trends.
Over time, you will discover the exact lifestyle adjustments that unlock your peak physical performance.
This proactive approach to wellness empowers you to take full control of your long-term health journey.
Pitfalls in Wearable Tracking: Bulk, Subscriptions, and Placement
Many wellness enthusiasts make the mistake of wearing large, bulky smartwatches to bed to track their sleep.
These heavy devices often shift during the night, leading to significant gaps in sensor data.
Furthermore, the physical discomfort of a thick wrist strap can actually disrupt your sleep quality.
Another major frustration in the wearable market is the hidden cost of ongoing monthly subscriptions.
Many popular brands lock your detailed physiological data behind expensive, recurring paywalls.
At Team Herz P1, we believe you should never have to pay a monthly fee to access your own body’s information.
The Herz P1 App is completely free for lifetime, providing unrestricted access to all your biometric charts.
We construct our rings from military-grade steel to ensure maximum durability in any environment.
This tough exterior is fully IP68 waterproof, allowing you to wear it during handwashing, swimming, or showering.
To maintain high data accuracy, make sure your ring fits snugly without being overly tight.
A loose ring can rotate on your finger, which prevents the optical sensors from maintaining proper skin contact.
If you experience sync issues, simply check your phone’s active Bluetooth connection and restart the application.
By avoiding these common hardware and software pitfalls, you can build a reliable, lifetime health tracking habit.
Many users also fail to clean their wearable sensors regularly, which leads to weak optical signals.
A simple wipe with a soft cloth once a week is all it takes to maintain pristine sensor performance.
Additionally, make sure you do not switch the ring between different fingers from day to day.
Keeping the device on the same finger ensures your baseline measurements remain highly consistent and accurate.
This attention to detail helps you get the most out of your advanced health tracking technology.
Frequently Asked Questions About HRV and the Herz P1
Is the Herz P1 smart ring waterproof?
Yes, the Herz P1 features a full IP68 waterproof rating.
This advanced design allows you to submerge the ring in water up to one hundred and sixty-four feet deep.
You can safely wear it while washing your hands, taking hot showers, or swimming in the pool.
How long does the Herz P1 battery last on a single charge?
Our smart ring delivers up to six days of continuous battery life under standard tracking conditions.
When the battery runs low, it charges completely in under one hour using our fast magnetic charger.
This long-lasting performance eliminates the daily charging anxiety associated with typical smartwatches.
Which finger is the best option to wear the smart ring on?
We recommend wearing the Herz P1 on your index, middle, or ring finger for the most accurate readings.
The index finger of your non-dominant hand typically offers the clearest arterial blood flow signals.
Ensure the ring feels snug but comfortable, and verify that the optical sensor pads face downward.
Does the Herz P1 store my health data offline when my phone is away?
Yes, the ring features seven days of local, onboard storage to protect your biological data.
It will continuously track your sleep, heart rate, and stress levels even without an active phone connection.
The stored information will automatically sync to your mobile application once Bluetooth is reconnected.
Conclusion
Decoding your body’s heart signals is the first step toward proactive daily wellness.
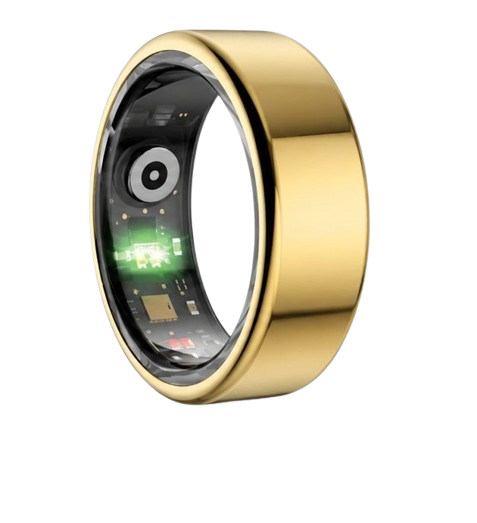
The subscription-free Herz P1 Smart Ring delivers reliable tracking to help you improve your life.
Ready to monitor your health every day? Explore the Herz P1 Smart Ring today.
Call: 1-866-479-1629 — our team can help advise on the correct ring size.
Note: Individual results may vary depending on individual health conditions, age, and lifestyle habits. This article is intended for general health reference purposes only.
